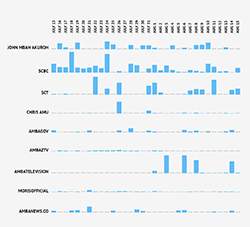
The first screen shows thirty days of data aggregated into a single quantitative measure and displayed day by day. The quantities are based on an individual or group Facebook account taking into consideration all posts, comments, shares, and likes for a single day.
Clicking one of the bars in the overview screen takes the user through to layer two.
JOHN MBAH AKUROH JULY 16
00:06
Breaking: Ambazonian MPs & Senators on Fire, Nigeria Not Sending Troops to Southern Cameroons!
00:06
13:07
LRC Baby-killing Regime Murders Ghanaian Clergyman in Batibo!
13:07
19:34
A big Burkina Faso newspaper says "Paul Biya has no Pity for his Country".
19:34
JOHN MBAH AKUROH JULY 17
11:11
USA State Department Worried about Killings of Women, Babies in Cameroon Contrary to some LRC sponsored social media messages going round claiming that the US Congress has indicted Ambazonian fighters as being worse terrorists than Boko Haram, let it be known that the government of President Donald Trump is rather very disenchanted against Yaounde for the ongoing genocide and mass killings. The US has taken particular interest in the video that showed soldiers shooting women and infants to death. Open the link below https://www.state.gov/r/pa/ prs/ps/2018/07/284129.htm
11:11
12:33
John Mbah Akuroh Reveals Evil Trap by Gendarmerie Legions in Southern Cameroons!
12:33
JOHN MBAH AKUROH JULY 19
18:17
Breaking News; LRC Anglophone Member of Gov't Makes Horrifying Revelations to Ambazonian People
18:17
JOHN MBAH AKUROH JULY 24
16:07
H.E Jerry John Rawlings former head of state and president of Ghana speaks on Ambazonia crises and why France and UN must find a solution to the occupation of Ambazonia. https://youtu.be/ qfCYT74MqdQ
16:07
16:20
Breaking News; Landslide Reportedly Claims Lives in Limbe after Heavy Rains Today
16:20
JOHN MBAH AKUROH JULY 25
23:46
Breaking; John Mbah Akuroh Hails Cardinal Tumi, Others, Says No to Dialogue
23:46
JOHN MBAH AKUROH JULY 28
05:32
Revealed; How Munzu Wrapped Cardinal Tumi, PCC & Muslims in Raw Deal!
05:32
JOHN MBAH AKUROH JULY 30
06:59
John Mbah Akuroh Rebukes Ekema Patrick, Refocus Restoration Message!
06:59
JOHN MBAH AKUROH JULY 31
12:32
N/A
12:32
17:53
N/A
17:53
JOHN MBAH AKUROH AUGUST 1
13:58
Keeping them Honest: Anglophonizing the Anglophone Crisis SW Provincialists & the Graffi Derangement Syndrome By Ekinneh Agbaw-Ebai In what unfortunately, has become the unedifying trademark of their favorite pastime, there is a surge of Graffi-bashing on social media platforms by self-elected guardians of the...
13:58
JOHN MBAH AKUROH AUGUST 4
10:42
Breaking Scandal; UN SG- Antonio Guterres Promises to Cover up Paul Biya's Genocide in Ambazonia
10:42
JOHN MBAH AKUROH AUGUST 6
10:30
LRC Attack Alert on Bali Nyongha!!!!!
10:30
JOHN MBAH AKUROH AUGUST 8
13:35
Breaking News; Yaounde Weeps as Ambazonians Converge in Unison
JOHN MBAH AKUROH AUGUST 9
21:59
Abduction Alert to GZ Commanders!
21:59
JOHN MBAH AKUROH AUGUST 10
13:45
SPARE THEIR ID CARDS PLEASE!
13:45
15:25
LRC Attack Alert on Bali!!!
15:25
JOHN MBAH AKUROH AUGUST 13
20:40
Breaking News; LRC Anglophone Ministers Speak Again, 2MNew Memos Leaked!
20:40